3D Digital Twins
Technologies
Project Description
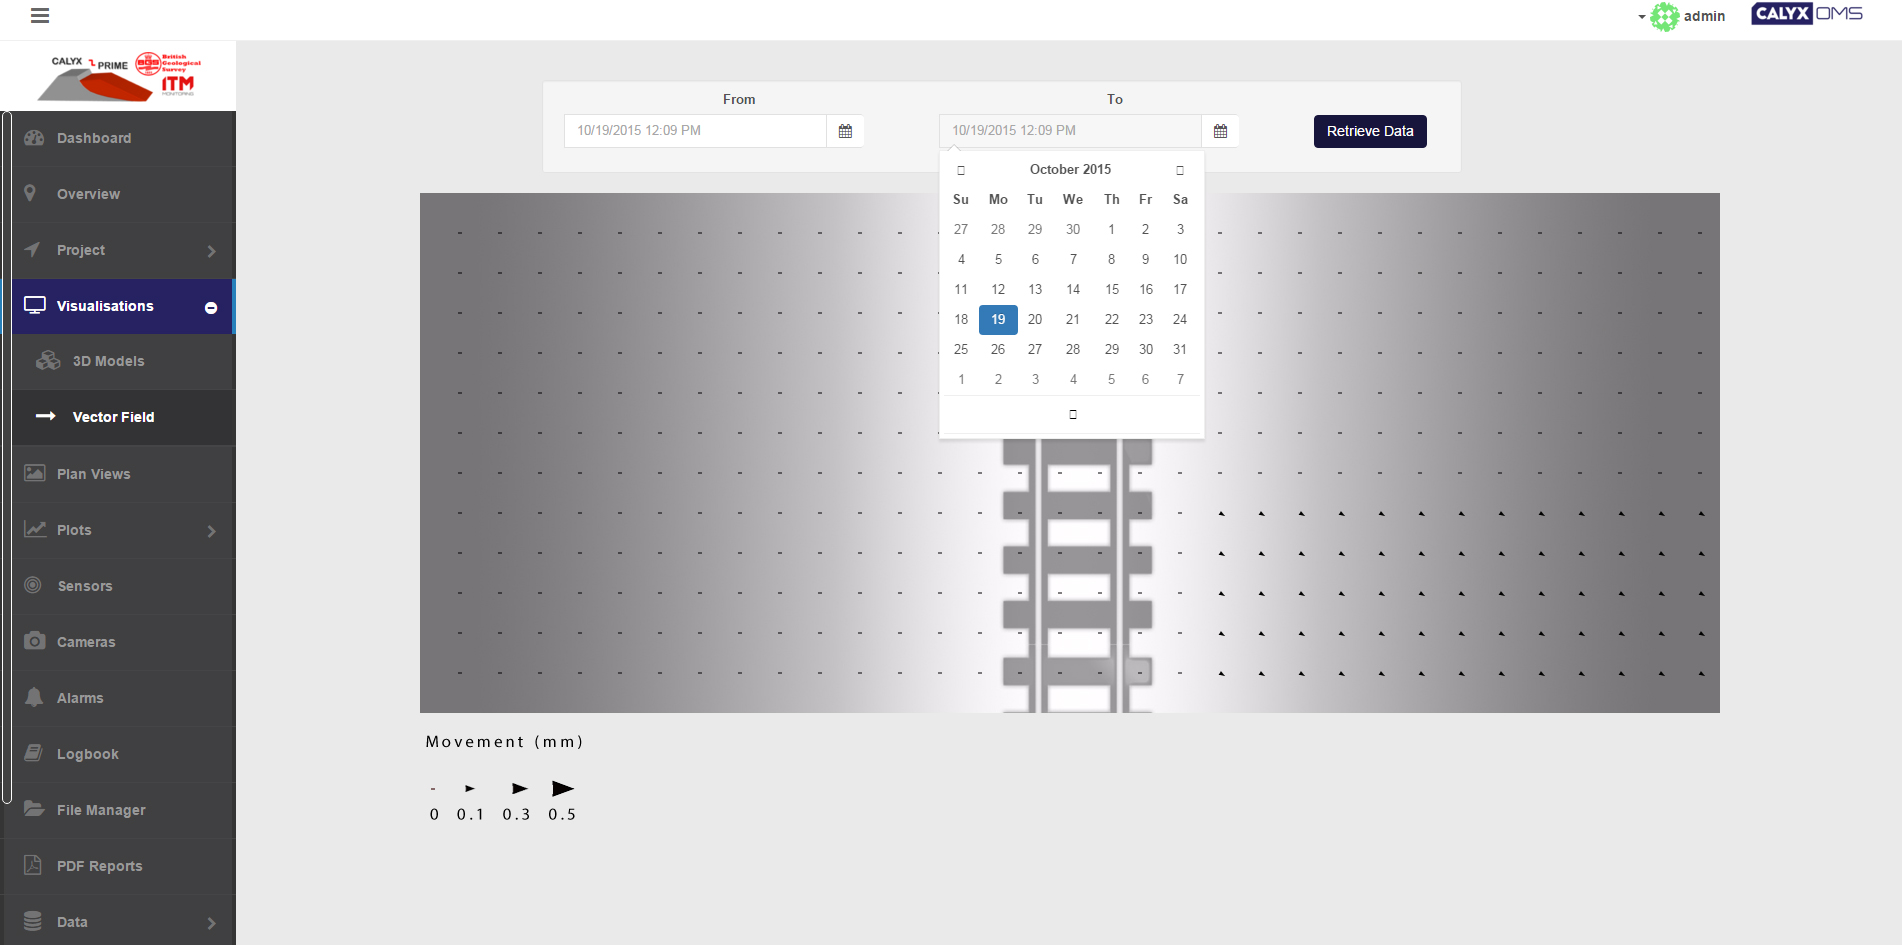
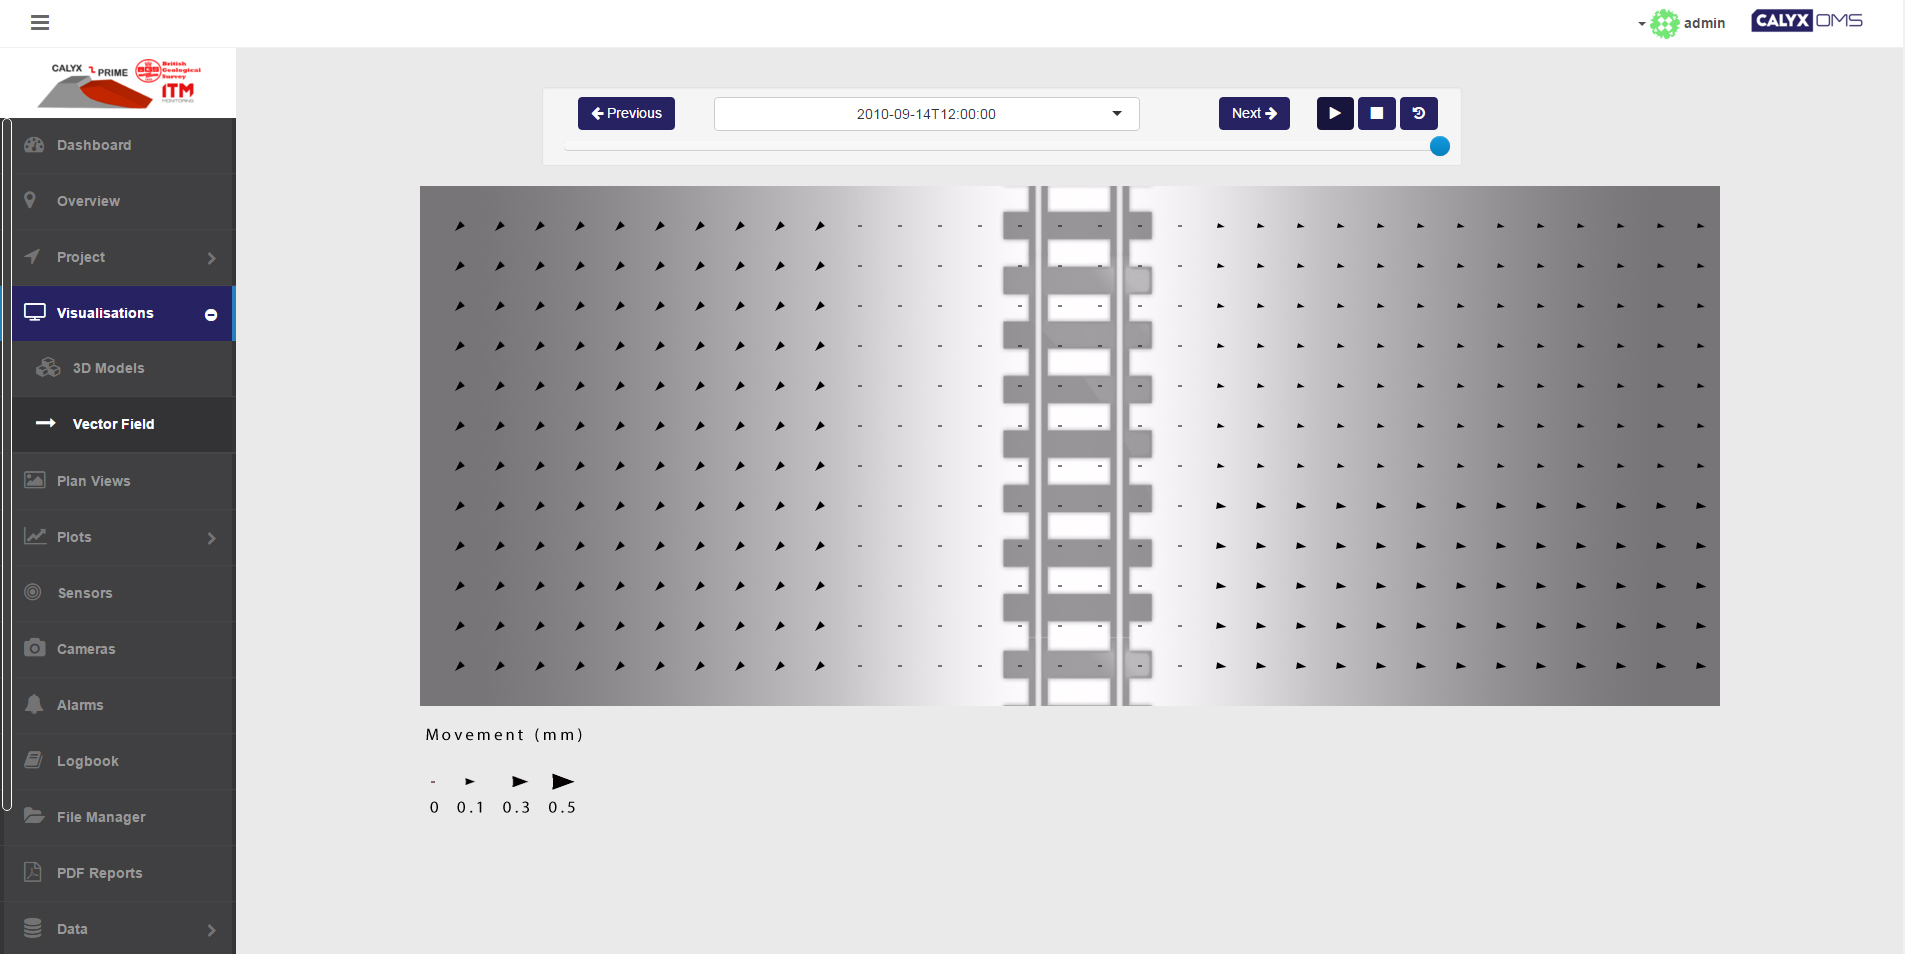
Calyx PRIME is an adaption of Calyx OMS to service the interface needs of the British Geological Survey’s experimental PRIME instrument – geolocated arrays of sensors monitoring ground moisture content within a surface, rendered both on a bespoke GIS interface and 3D data management and interrogation tools delivered exclusively in browser by Digital Tactics.
Screenshots
Strategy
The Calyx OMS platform understands data for individual sensors* i.e. devices that produce one reading per time period.
The electrical resistivity tomography device created by the British Geological Survey for the PRIME project is an array of regularly spaced electrodes, which are embedded in the ground and work together as one device returning multiple readings for any one time period.
These readings being a translation of electrode resistivity measurements to ground moisture content (GMC), represent the soil moisture within the cube-like** (voxel***) structures formed between sets of any four electrodes in the resulting mesh, at a particular set depth into the ground.
The first challenge in this project therefore was to convert the PRIME data files into a format Calyx OMS could interpret and analyse; breaking the each single large set of related readings logged at any particular time into something more workable that the system would understand.
To do this we extended the idea of treating the data between the electrodes as voxels to each voxel being treated as a discreet sensor in Calyx vs. the device as a whole being considered as the sensor.
Considering data in this way, piece by piece, allowed us to then consider each voxel/sensor in the mesh as a discreet building block of the device, with its own assigned properties. As a result Calyx would have information it could interpret and we become able to apply the full range of data management and interrogation tools (charting, alarming, etc.) the system has to offer on a very granular level.
However, while being to analyse and alert on any one voxel in the structure is useful, in an average mesh 11 electrodes wide, 31 electrodes across, and 11 layers deep (3,410 voxels overall), the individual voxel data soon gets lost in a sea of other information. The tool would be much more useful if sub-volumes (collections of spatially correlated voxels within the structure of the device) could be defined and monitored also.
Calyx OMS already allows for the bespoke calculation of values based on individual sensor values, or combinations of sensor values, through its virtual sensor formula editing interface. This functionality is used in general Calyx operation to create derived sensor values from multi-value sensors (e.g. those with an x, y and z reading), or to provide a consistent correction to a sensor value.
In this implementation however, the same functionality in combination with a common Calyx based reference system for the data, allows us to combine clusters of related voxels (even all voxels if so desired) and treat the set as another single sensor value which can be measured, tracked over time, charted and alerted upon if its value breaches a certain threshold.
By handling the data generated by each device in this way, we are able to use Calyx OMS to provide a powerful set of tools to interrogate the data created by PRIME devices on a granular level, on a combined basis for defined sub-volumes, and for the device as a whole.
Execution
Once the process for understanding PRIME data within Calyx had been defined, we were then able to look at how Calyx might import that data for standard use. We had a number of options open to us for the import process (creation of a bespoke offline tool to convert the data into a format Calyx could understand, the creation of a native Calyx import filter for the data, and others) and rapidly arrived at a way of ingesting the data that made sense.
Once the initial import system was complete and the data was tested and verified using standard Calyx tools, our next (and main) challenge was to construct an interface for the data that visualised this information in a way that made sense within the context of each device (and therefore each PRIME monitored area) as a whole.
Such a visualisation would be required to understand how the individual voxel data relates to itself over time; to other voxels in the mesh; to defined sub-volumes; and to the device overall.
The data itself is inherently three dimensional and therefore to understand how it changes over time throughout the structure, the visualisation of it also had to be three dimensional, and ideally animated over time to deliver a full appreciation for how the area monitored by the device changes from reading to reading.
Traditional 3D modelling programs have been in existence for many years and can do some amazing things, but all carry a technical, operational and www.skill based overhead which can become costly over time. Furthermore the majority of these tools are offline systems only, meaning that they typically have to run in isolation, which doesn’t really fit with the Calyx OMS model of being an easy to use, online, access-anywhere platform.
We investigated a number of options for visualizing the data offline (blender, paraview, etc.) but found that none of these tools provided the simplified functionality required for this project.
Furthermore the most they appeared to be able to do in terms of visualising the datasets (at least in the time we had to examine them) was to draw the wireframe of the device based on the co-ordinates provided and then plot a surface over the wireframe illustrating the data on the surface alone. There wasn’t a good, adaptable way to “cut through” the data and understand what was going on within a dataset.
The general end result for web usage of these existing systems was simply a static image of the 3D model in a particular orientation, not something you could really interact with in any useful form online; or a fully rendered 3D model (usually plus a series of unnecessary or inappropriate controls) that you could look around but not interact with in any useful way for this project.
In short, 3D modelling tools are 3D modelling tools, not live data analysis tools or data management interfaces; just as Photoshop is an excellent image editor you can draw a graph in but it’s not Excel. Using these traditional solutions would have resulted in something but this something would be a poor-man’s version of the solution we aspired to deliver within Calyx OMS.
Relatively recently (last 3-4 years) web browsers have supported rendering 3D data natively through WebGL an implementation of the OpenGL standard supported by most modern graphics cards and chips (including those in tablet and mobile devices).
So, after much deliberation, we opted to build our own 3D data visualisation and manipulation interface within Calyx which worked natively (i.e. with no additional plugins or unusual add-ons) within the browser. As with most web technologies there are a (small) number of common technologies for rendering 3D scenes in the web browser which form a good basis for this kind of work and we opted after some investigation to build atop three.js.
three.js is an efficient and popular JavaScript library which wraps the WebGL API’s in various browsers and provides a common interface for handling 3D modelling tasks directly in Google Chrome, Firefox and others which support the WebGL standard. It provides a number of good out of the box features for creating standard 3D objects (cones, spheres, cubes, polyhedrons) and then hooks for interacting with the objects created.
As with anything new to web developers the instant way to learn a new library is to stand on the shoulders of those who have gone before; following tutorials to conduct simple tasks and extending these out to reflect the needs of the project. However in our case for this project, while some developers had developed some similar kinds of (unrelated) solutions which offered some aspect or other of what we felt we wanted to deliver no-one it appeared had quite created something we could really base our work upon here, which led to some very interesting dead ends before getting to the final result!
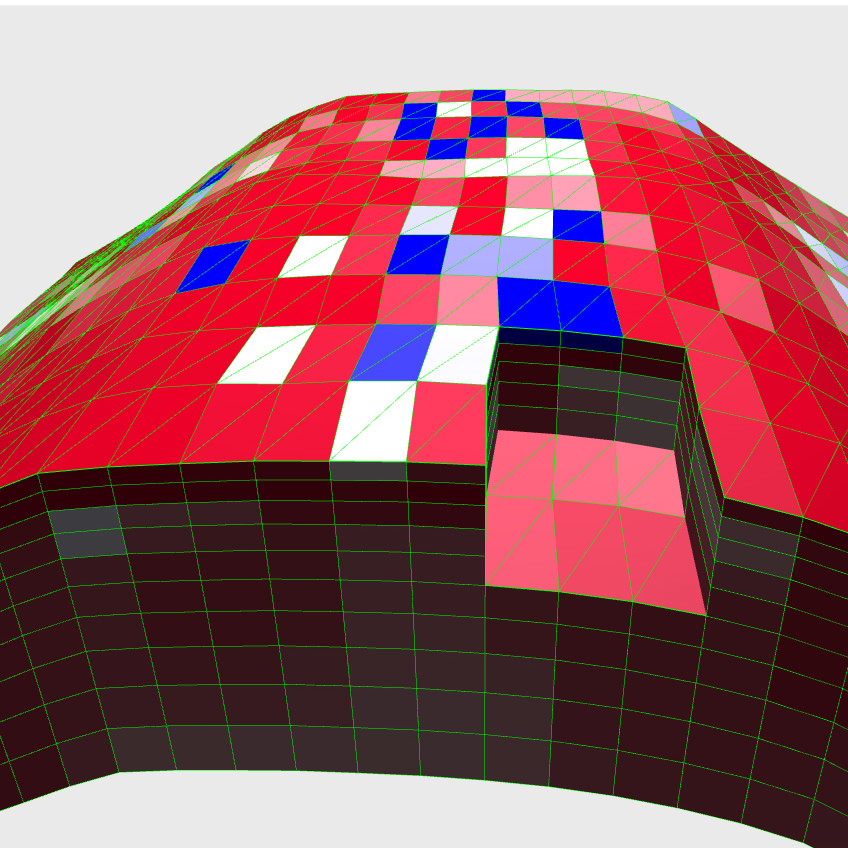
While we tried to work with standard shapes and similar offered by three.js for this kind of endeavour, they didn’t really produce a good result: Using cubes we were able to create a Minecraft like blocky representation of the mesh that was technically serviceable from a data visualisation point of view, but lost some meaning as it didn’t reflect the physical profile of the installation exactly; Using polyhedrons we were able to create a strange representation that appeared to fold into itself which was completely wrong; So we eventually had to develop our own objects from scratch to service each unique irregular cube-like shape that every voxel in the mesh has.
Thankfully, three.js allows us as developers to construct 3D objects point by point; triangulate points to form solid faces; and then combine faces in sequence to form polyhedrons. It then allows us to colour the faces of these polyhedrons as we like; co-ordinate them relative to one another; and use JavaScript to interact with them.
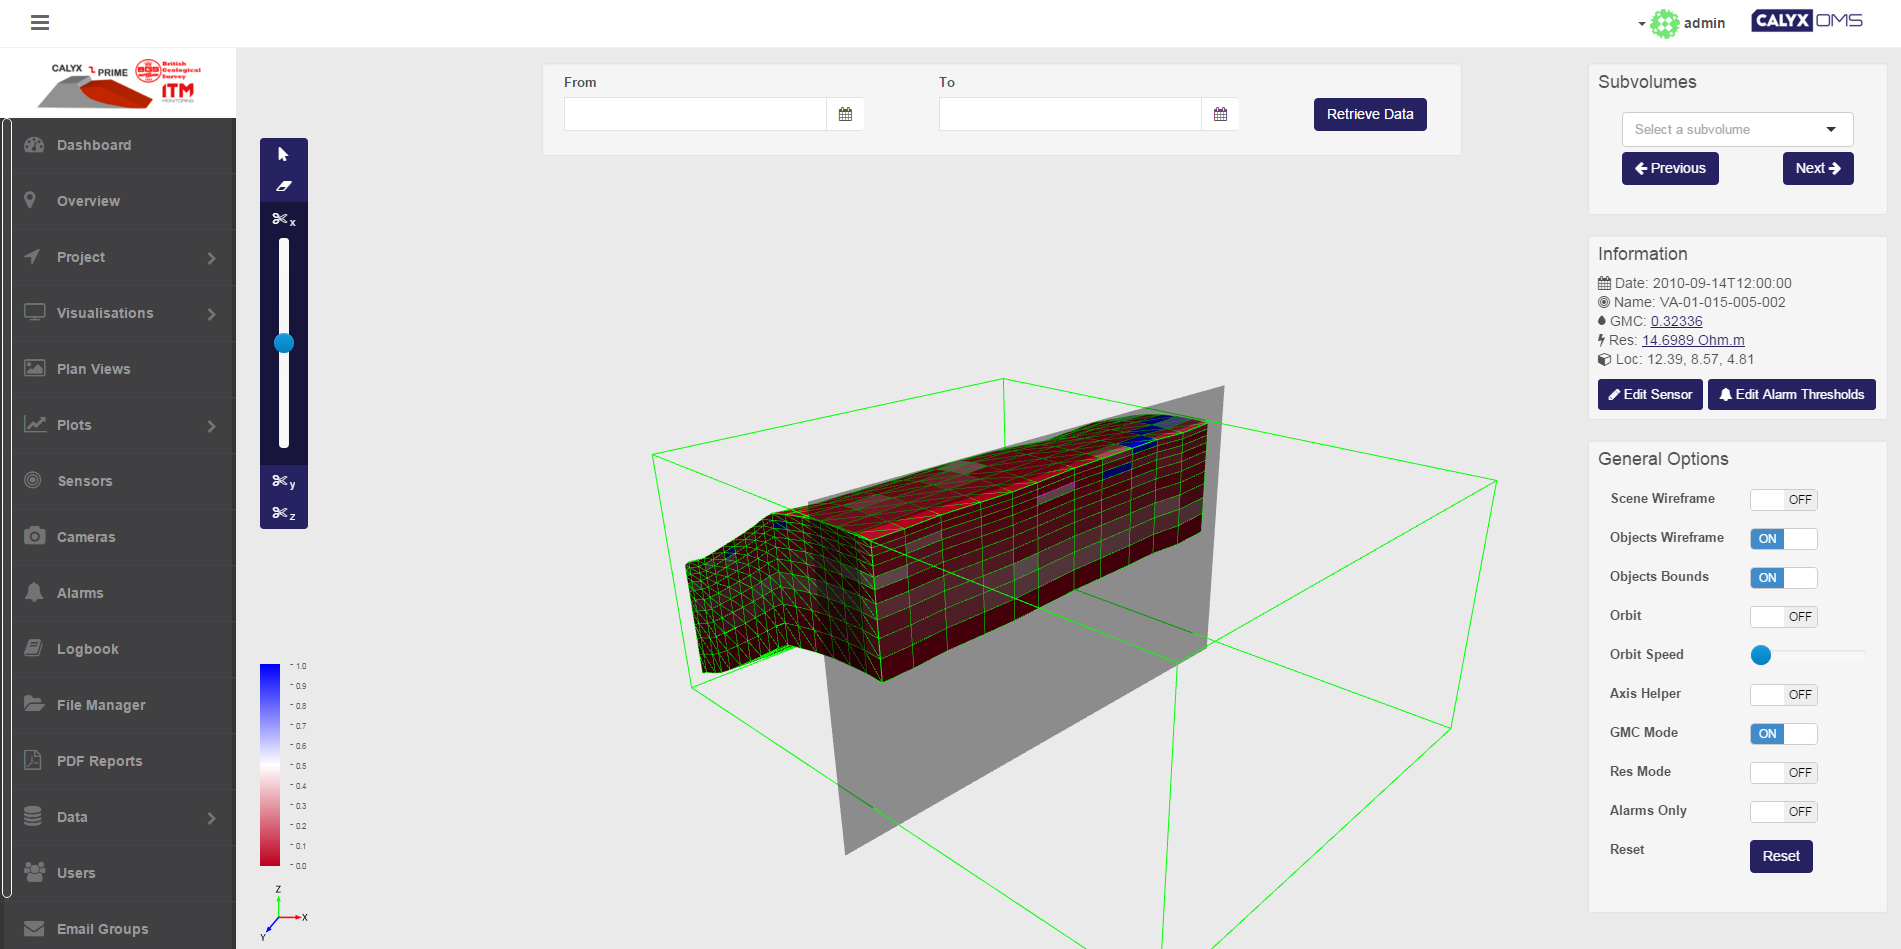
So, by using three.js in the browser to render the PRIME dataset retrieved in a relevant format from Calyx, we instantly realised we could do more than simply visualise the data; we could in fact construct a fully interactive 3D interface to the data, which allows the scientists and engineers working with the information to truly understand the data presented. So this is what we did.
By understanding how the PRIME data file is constructed as well as the pure data (co-ordinates and values) presented therein, we were able to determine which co-ordinate points make up the vertices of each voxel, and then define a simpler coordinate system to describe which voxels are nearest neighbours to each other in the mesh (and therefore share vertices).
Using the raw co-ordinates then, we were able to use three.js to build individual 3D models of each voxel in the structure, and then correlate these together in space based on the shared vertices to describe the device as a whole, similar to piecing together a huge 3D jigsaw puzzle or Lego construction from blocks.
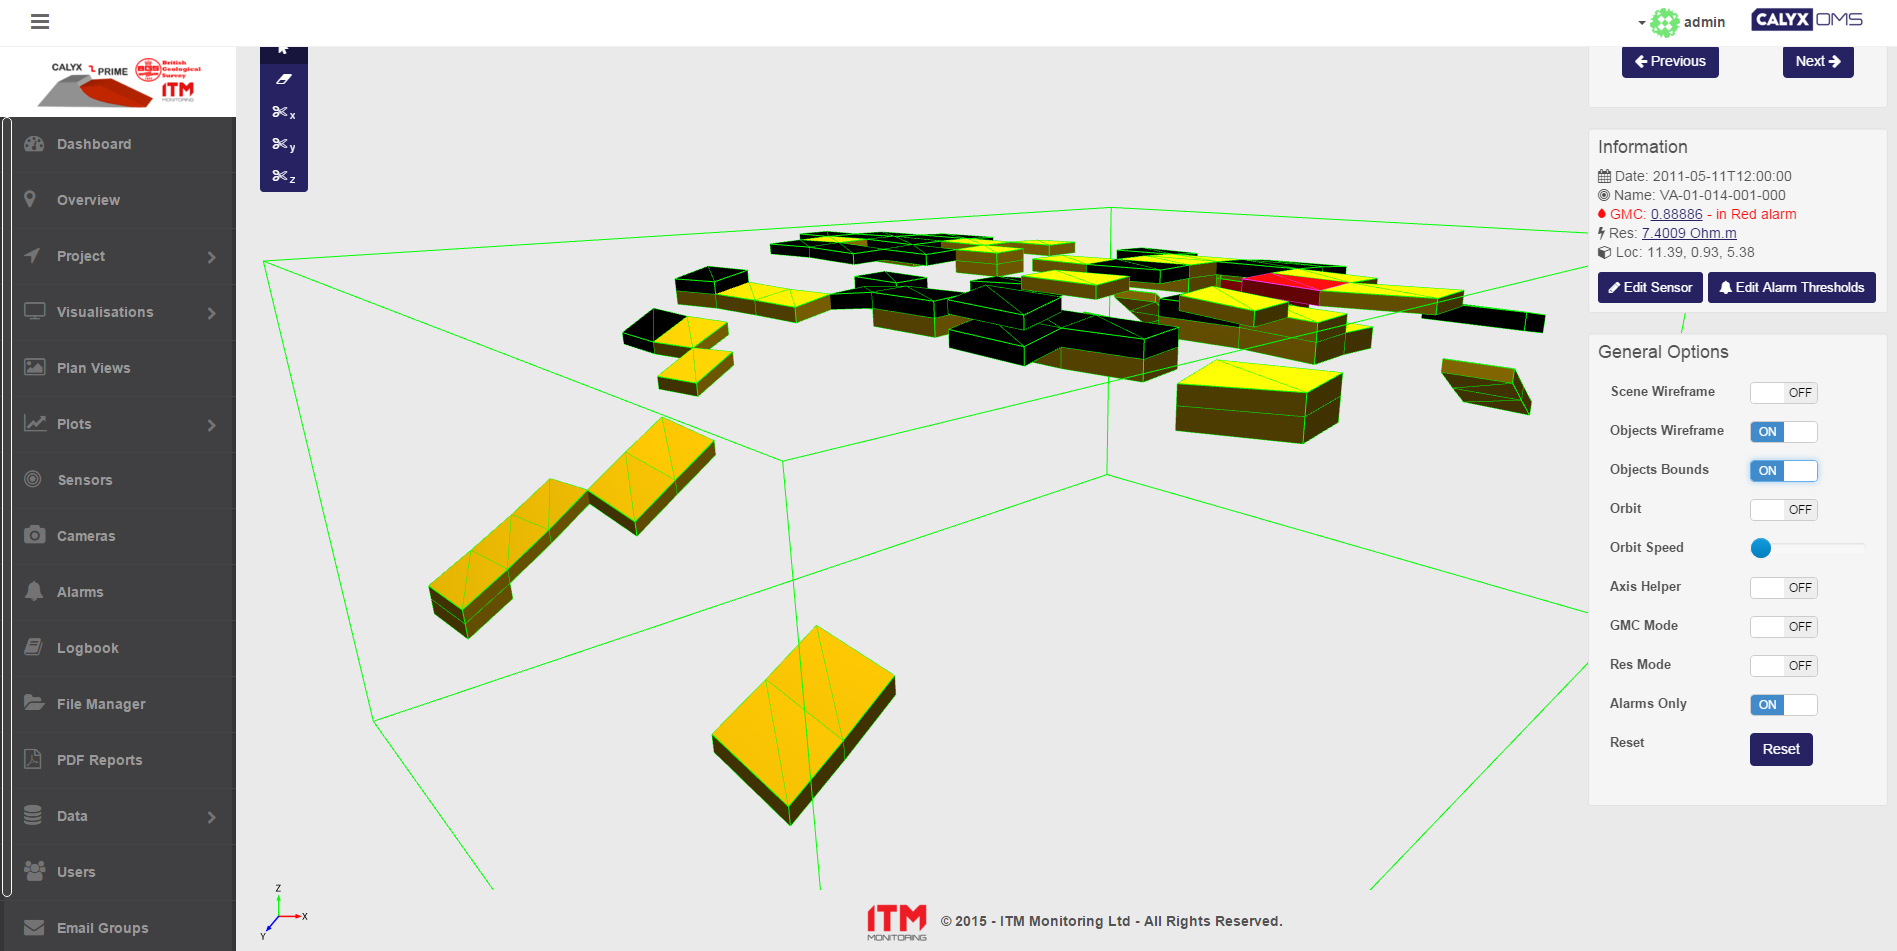
Building the model up in this way is important as allows us to go beyond a simple surface rendering across the 3D wireframe and down to understanding each component voxel in the mesh as a discrete object. These objects can subsequently be annotated with data; coloured appropriately (to describe threshold changes or alarm states); and manipulated/have further interactions applied to them (such as making them disappear to reveal other voxels deeper in the mesh, or switching between a model describing the distribution of GMC across the device to illustrating key alarm points within the mesh).
Result
With this way of constructing the model in hand we were able to then build a suite of interactive tools to work with the data ingested, such as those listed below and illustrated in the forthcoming video of the solution (currently in production):
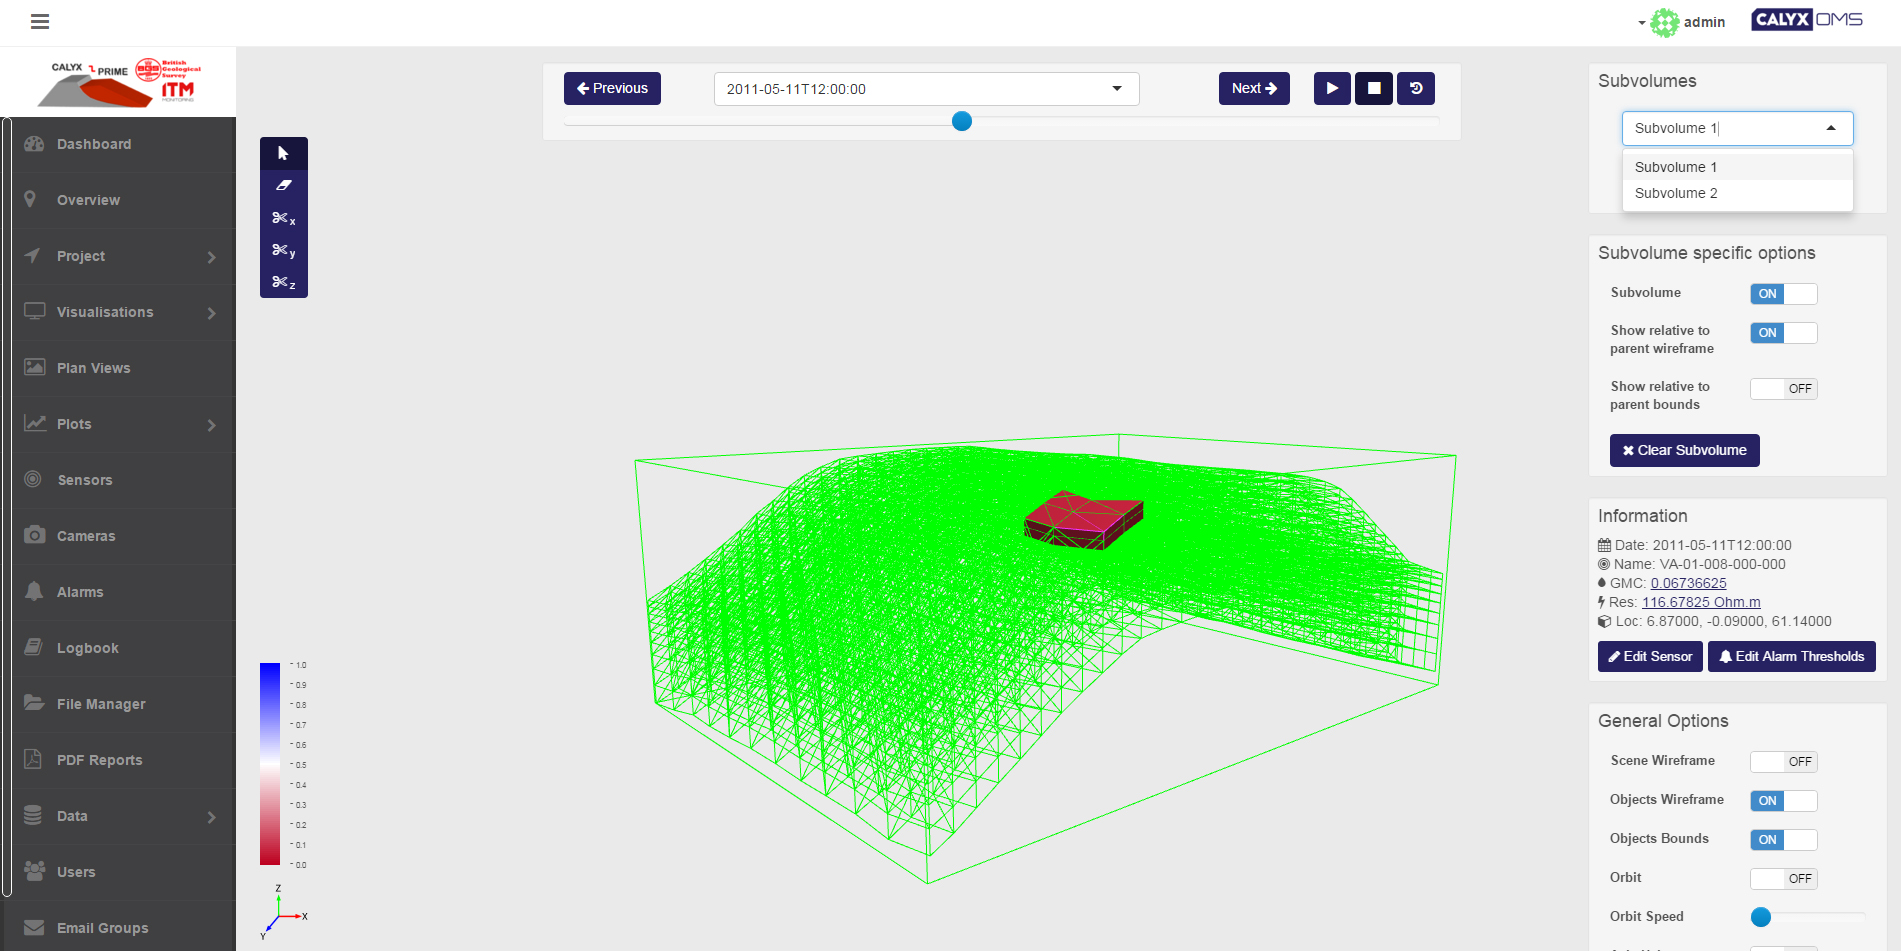
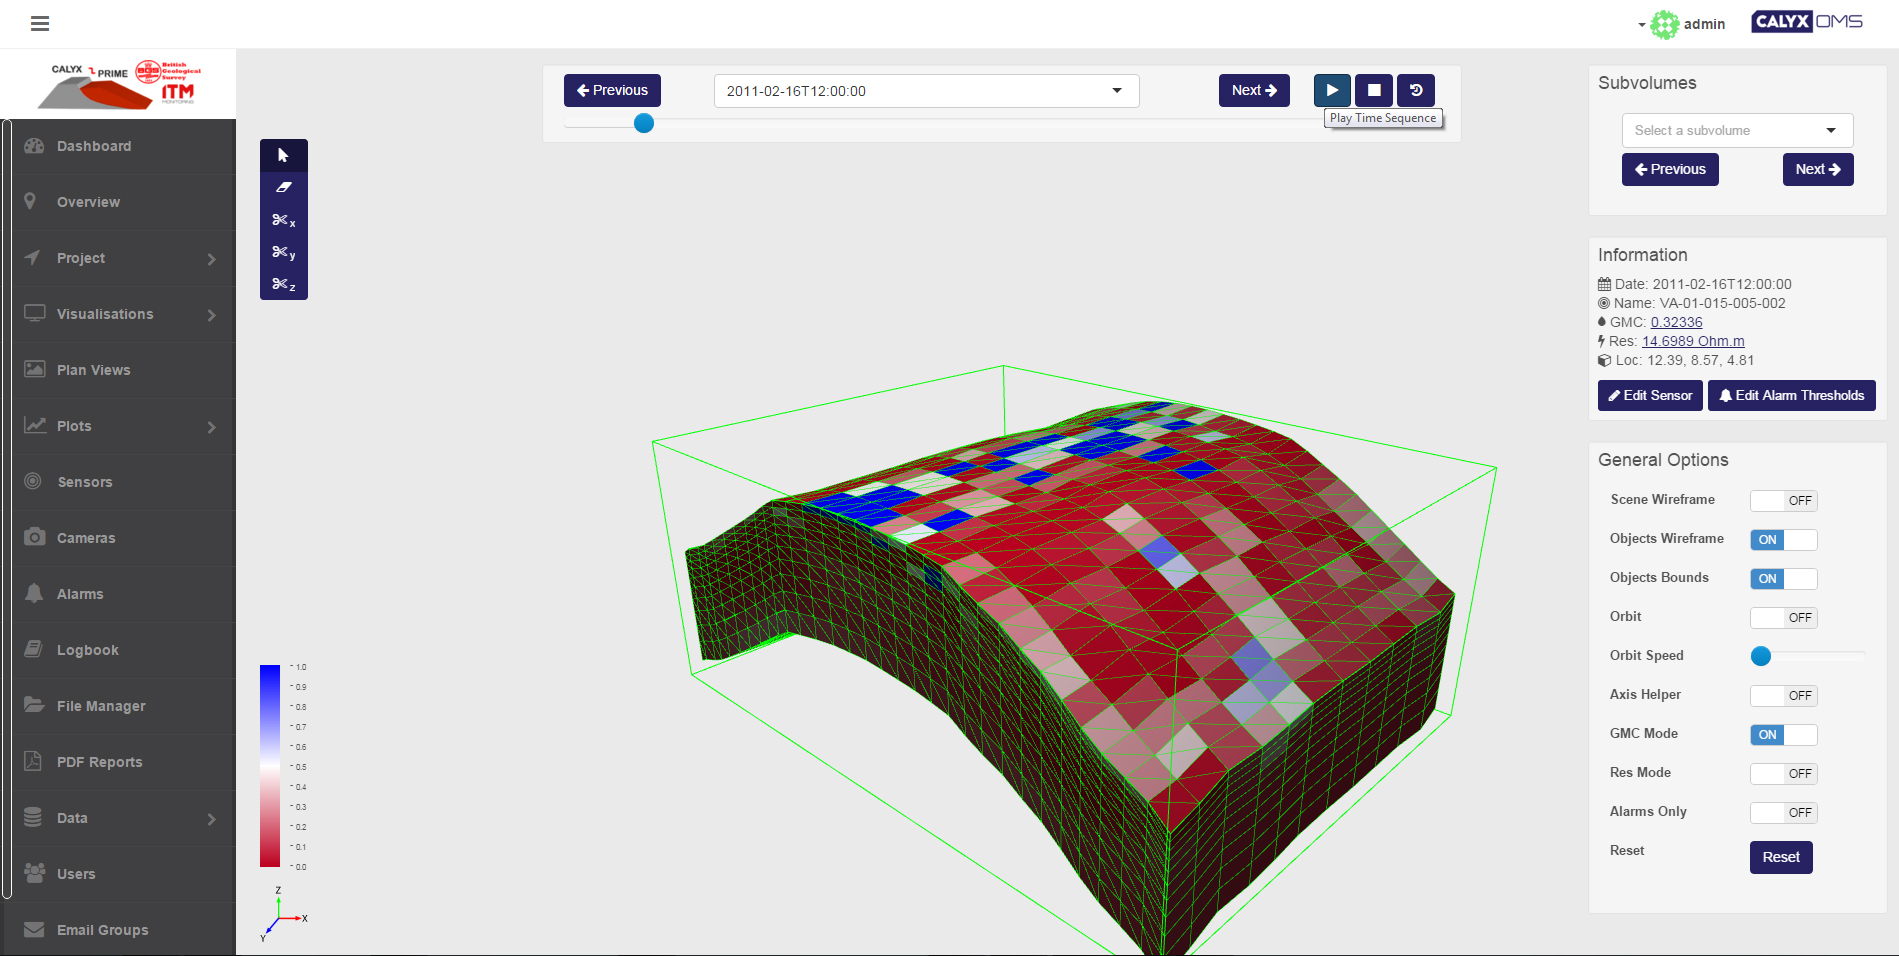
- Play through 3D scenes over time for the entire device or specific sub volumes
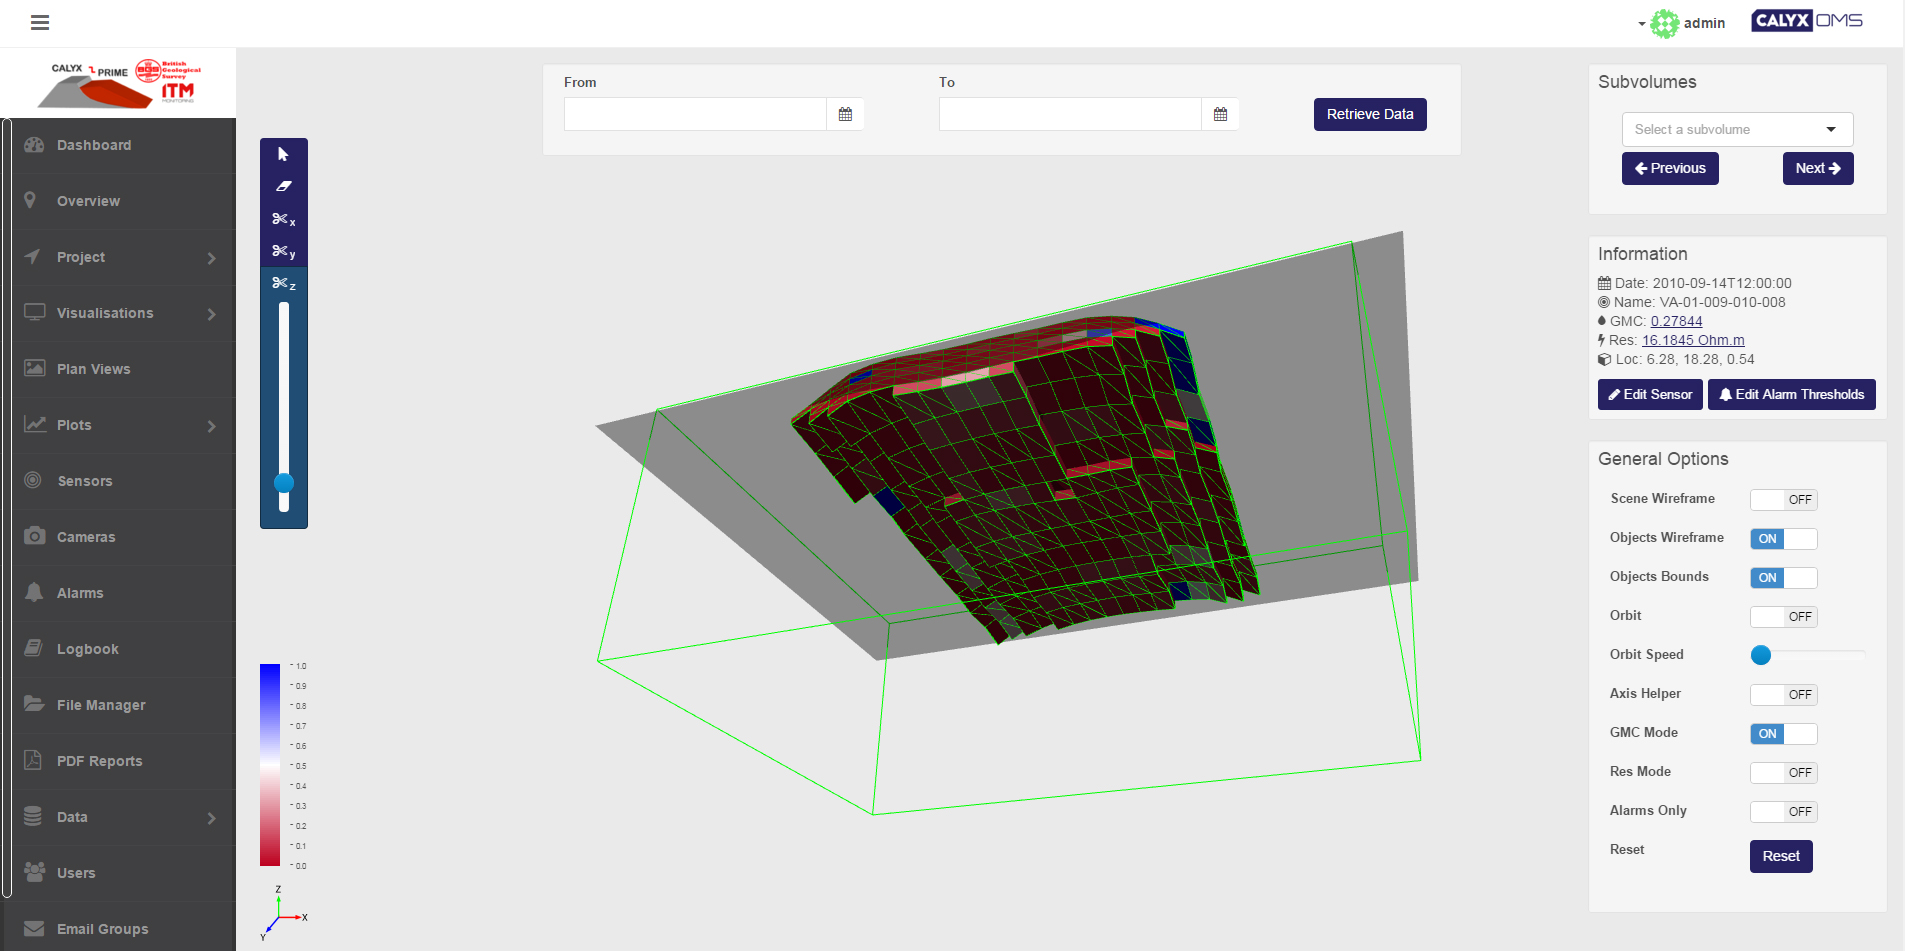
- Deconstruct the model voxel by voxel in real time to investigate specific areas of interest
- View structural changes (deformations, sliding) in the device over time
- View voxels and sub-volumes within the context of the wireframe of the device
- Step through all defined sub volumes one-by-one
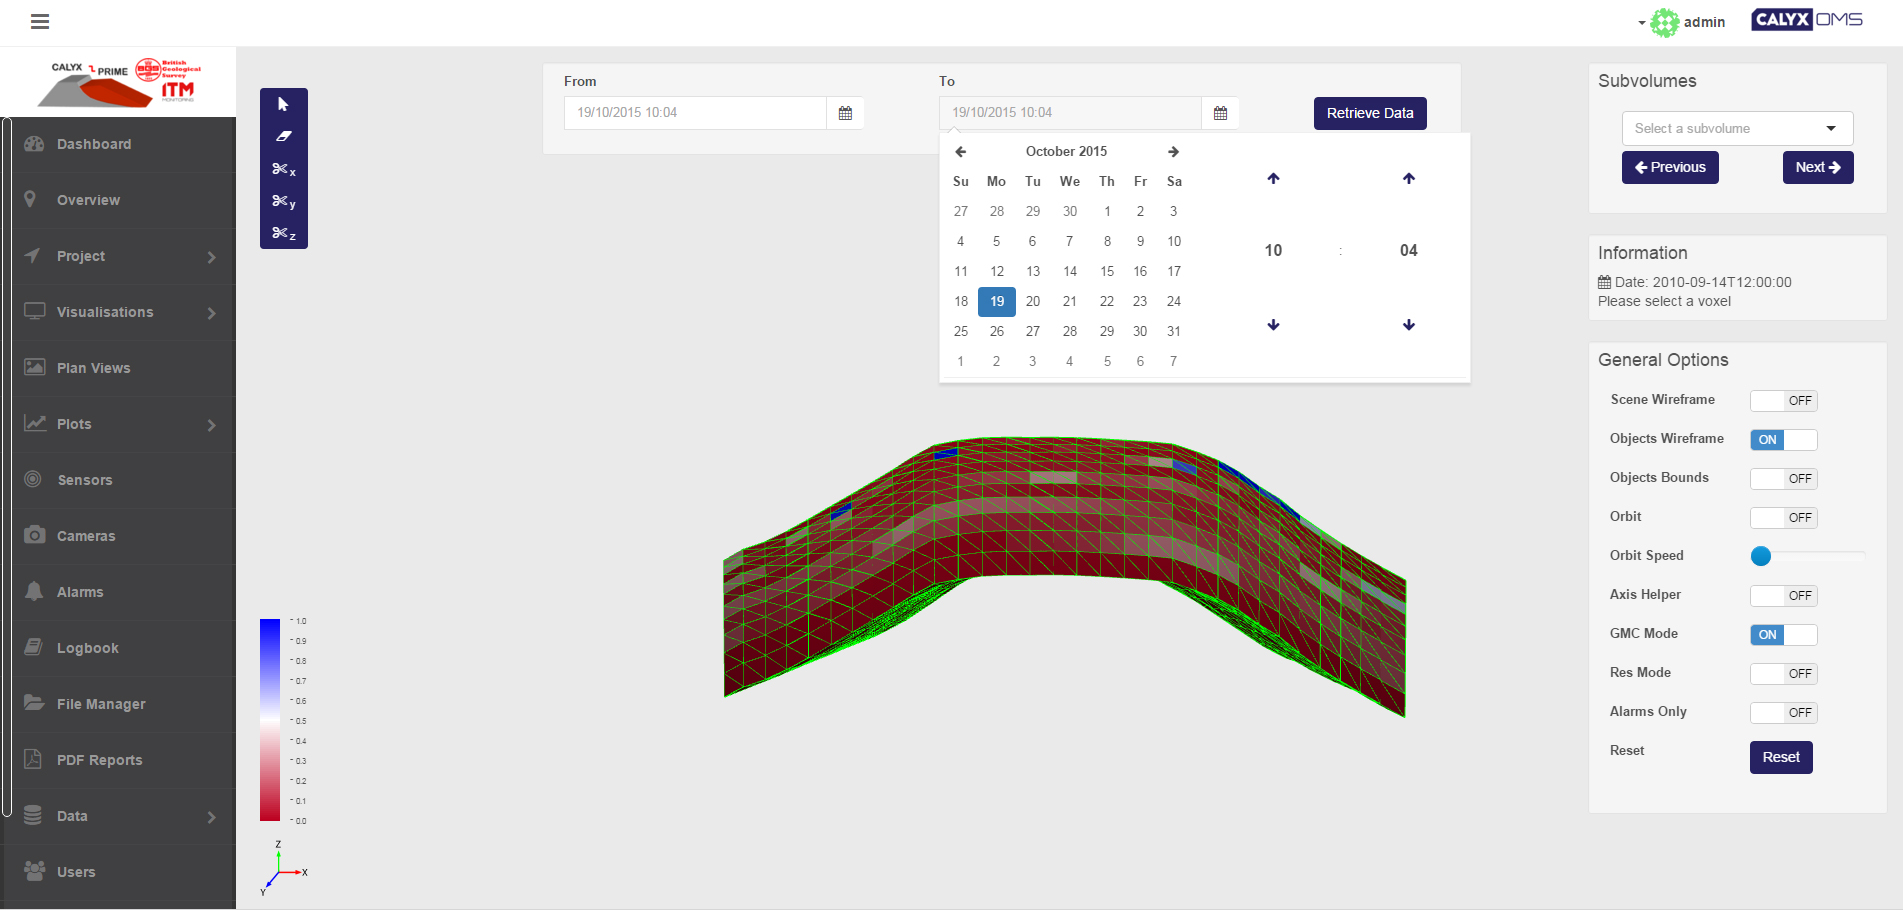
- Pull data back for any specific voxel or sub-volume
- Chart or report on any specific voxel or sub-volume
- Change the configuration settings of any particular voxel or sub-volume
- Slice through the model in x, y and z directions to understand how the internal readings within the device are changing over time
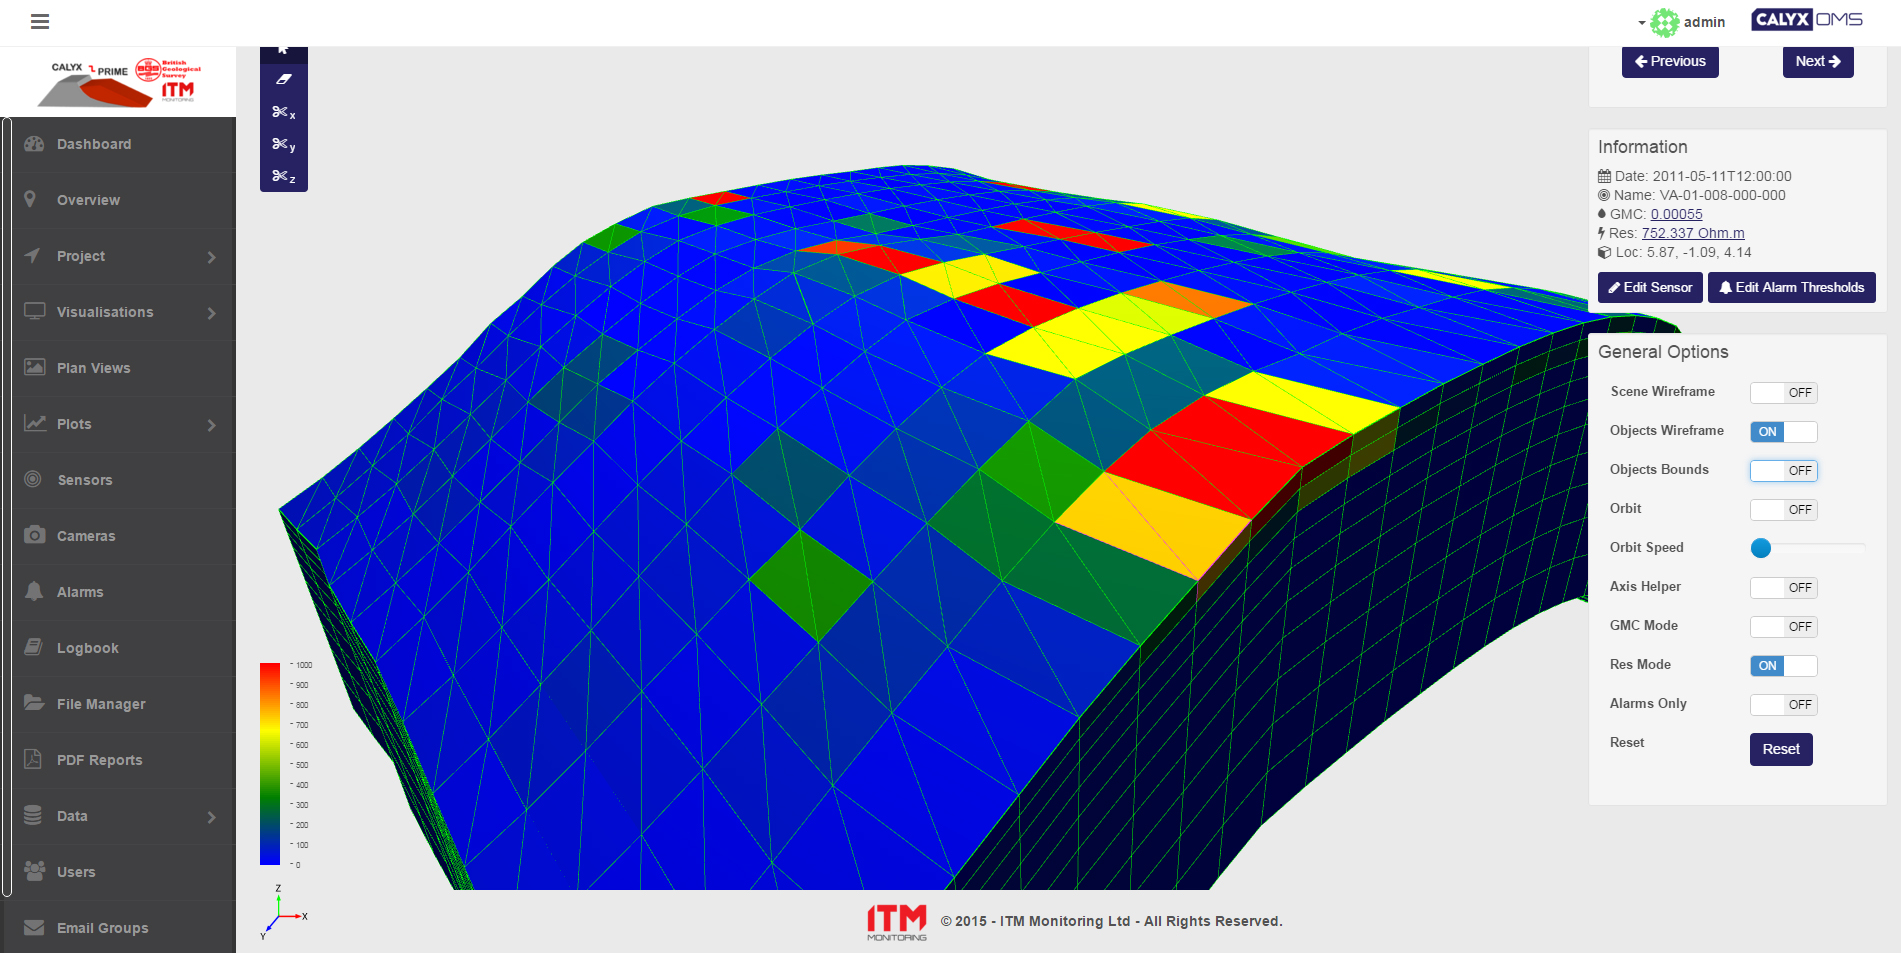
- Switch data visualisations in real-time from GMC readings, to raw resistivity readings, to alarm states for both the entire device, selected voxels and defined sub-volumes
- Augment the data with information from other sources (such as weather stations)
- Orbit the model and leave running in a full screen mode
- And much more in the future
Behind the scenes this work is also making use of a novel integration between three.js and AngularJS to update the model with data dynamically from a custom Calyx OMS API written exclusively for this service. It has had optimisations applied to work with lower level WebGL functionality exposed through the three.js buffer geometry to improve rendering efficiency and therefore speed on a variety of platforms. It also works on all modern tablet devices and mobile phones and should be able to update with data live over time when in production meaning it could be displayed on TV sized screens in a management office for ongoing monitoring.
The result is the visualisation you can see provided in the screenshots to your right, and we’ll be adding a video here soon of the solution in action.
The solution has been well received by key project stakeholders and is a piece of work that we’re extremely proud of.
We believe interfaces such as this hold great potential for understanding and working with large 3D data sets in the future, in a variety of industries and academic scenarios and will be pursing further research and development and project work in this area throughout 2016 and beyond.
Should you wish to talk about this work further or discuss a project of your own in this area please contact us here
Footnotes
*Multi-position sensors are actually supported by Calyx OMS however this is an extreme case of such a device.
**Cube-like as the co-ordinates of the electrodes do not describe perfect cuboid shapes in the mesh, due to positioning issues, ground profile, ground makeup and similar.
***As these spaces are not uniform cubes these are not true voxels, though the term is convenient to describe the space
Client Details
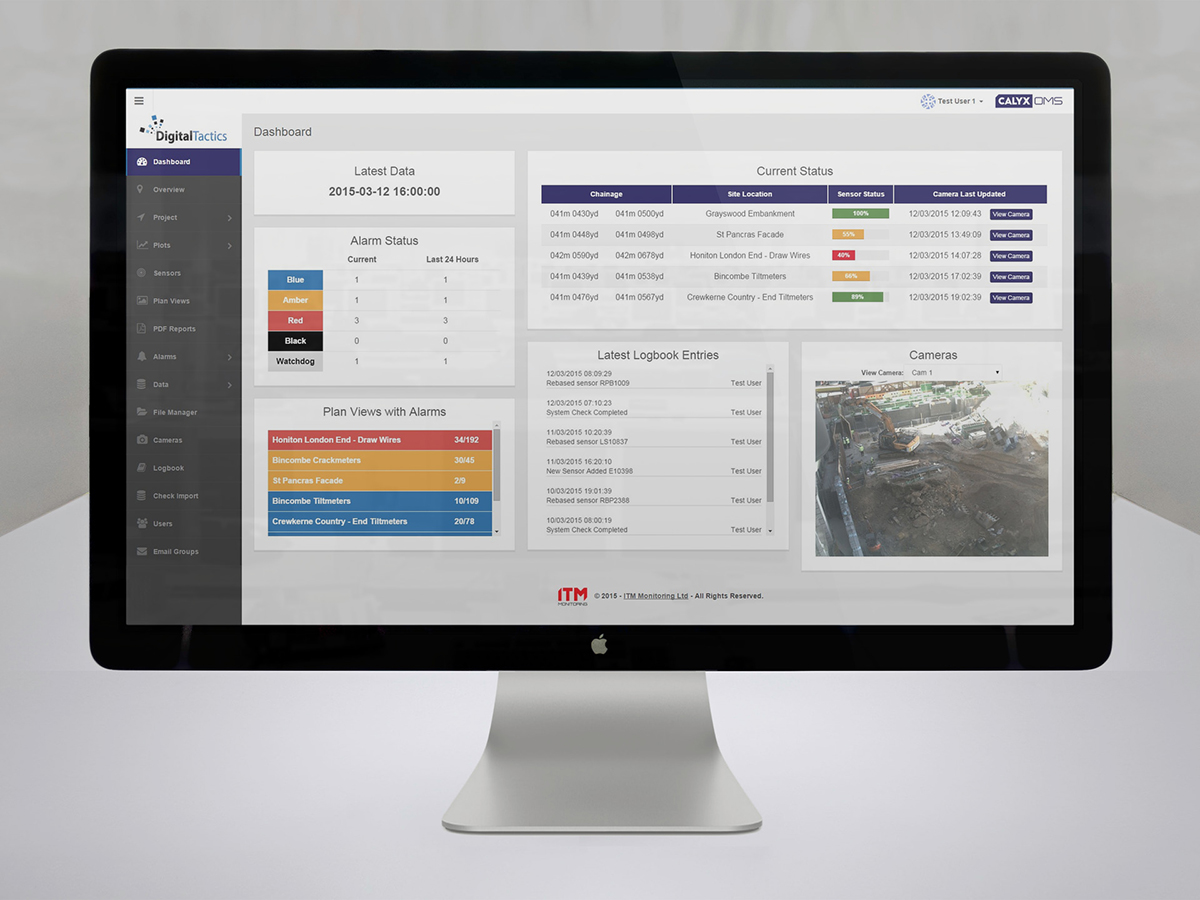
Digital Tactics works with ITM Monitoring to deliver big data visualization, reporting and management systems for its internationally renowned services.
Related case studies
Our user-friendly, secure data management and presentation tools provide quick and easy interpretation of large amounts of data from multiple sources.

We have been building and managing cloud hosting platforms for a variety of projects for over seven years and are now AWS Advanced Consulting Partners